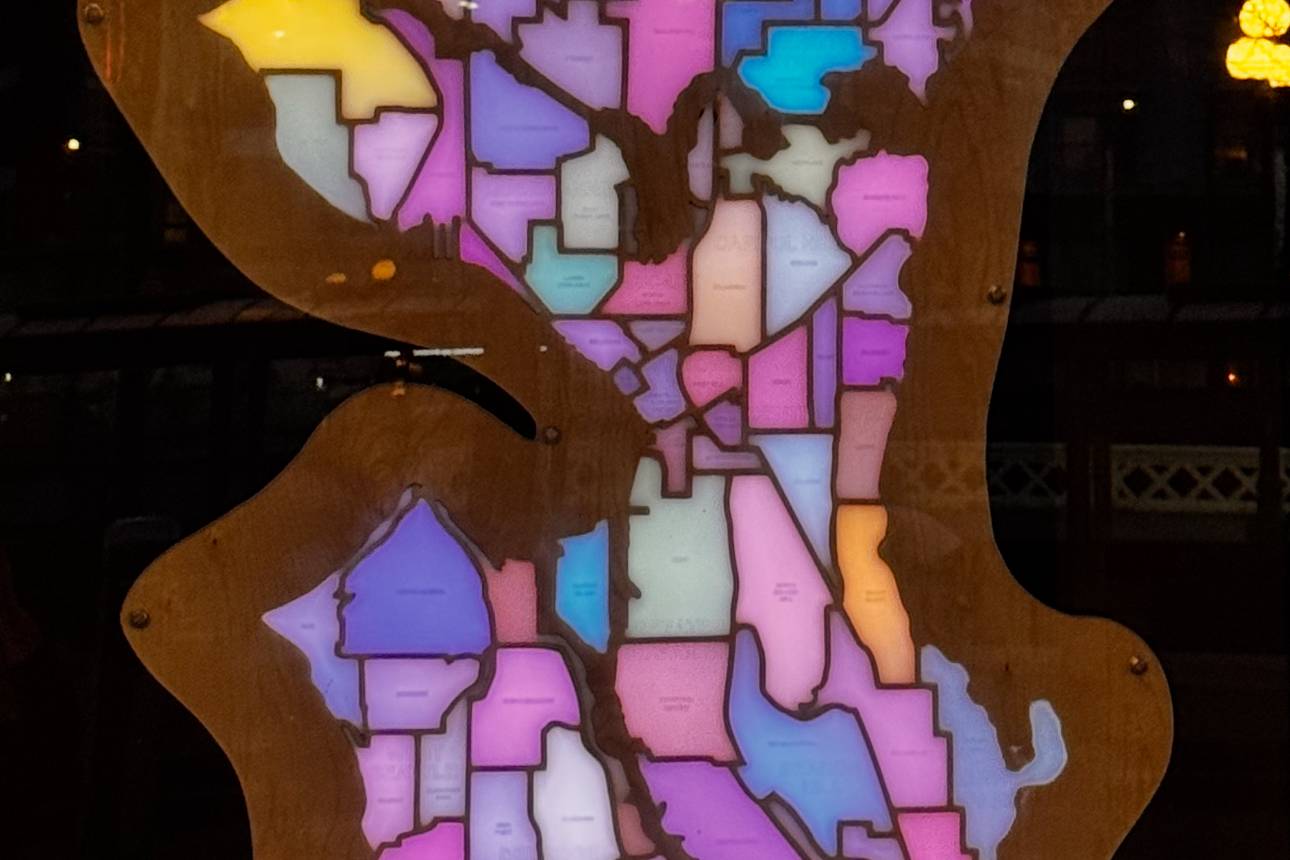
Each light node represents one King County town or neighborhood. The nodes are places roughly by geographical location around the blue “lake” in the middle. The data was collected by our related project in FUSE Labs, http://whooly.net, which shows what is happening in neighborhood communities right now in Twitter. We performed frequency and sentiment analysis to animate the neighborhood nodes.

This project was completed in collaboration with Reena Kawal and Janice Von Itter for light display, and Morgan Hammer for metalwork.  After being displayed at the Microsoft Employee Art Exhibit, it was placed in Microsoft Research lobby for about a year.

The Neighborhood Table

The neighborhood table evolved from a project we did at Maker Week, a Microsoft hack week hosted by FUSE Labs. Inside the table are individually addressable RGB nodes, with each one representing a local King County neighborhood. The node lights show the current activity and mood for each neighborhood based on sentiment expressed in recent Twitter messages. This is an exploration in embedding ambient social media data in everyday objects.

My role in this project was concept development, project management, the neighborhood data analytics, and LED programming.


EventMicrosoft Employee Art ShowLocationMicrosoft ResearchYear2014Size48"x48"x24"Created byShelly Farnham, Morgan Hammer, Reena Kawal, Janice Von ItterMaterialsMetal, acrylic, PC, raspberry pi, programmable LEDs